
Page 82 - FoodFocusThailand No.172 July 2020
P. 82
STORAGE, HANDLING & LOGISTICS
2.1 Experimentation To
minimize the impact from the ambient
temperature and replicate the delivery
condition in Thailand, the temperature
in the lab was controlled at 25 ± 1.5°C
during the whole physical simulation
experiment. Next, each box was filled with
1,000 ml of cold water (8.0 ± 1.5°C) as a
cold food item. The water is used to minimize
the interference of thermal conductivity from
uneven food physical properties. Four data
loggers were placed throughout the box and the
temperatures were recorded every 5-minute
interval over the simulation period of 3 hr for each
box. There are recommended by the practitioner
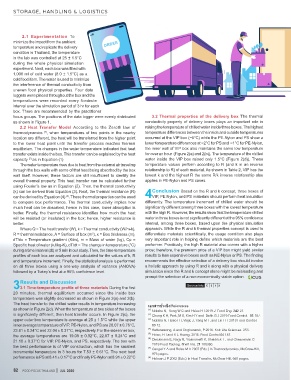
focus groups. The positions of the data logger were evenly distributed 3.2 Thermal properties of the delivery box The thermal
as shown in Figure 1. conductivity property of delivery boxes plays an important role in
2.2 Heat Transfer Model According to the Zeroth law of raising the temperature of chilled water inside three boxes. The highest
thermodynamics , when temperatures of two points in the nearby temperature differences between the inside and outside temperatures
[7]
location are different, the heat will be transferred from the higher point occurred at the VIP box (~5°C) while the PE-Nylon and PS show a
to the lower heat point until the transfer process reaches thermal lower temperature differences at ~2°C for PS and ~1°C for PE-Nylon,
equilibrium. The changes in the water temperature indicated that heat the inner wall of VIP box also maintains the same low temperature
transfer exists inside the box. This transfer can be explained by the heat for over an hour (Figure 2(a) and 2(b)). The temperature of the chilled
capacity as in Equation (1) water inside the VIP box raised only 1.5°C (Figure 2(d)). These
[7]
The water temperature rises due to heat from the external air traveling temperature values perform according to R (and k in an inverse
through the box walls with some of that heat being absorbed by the box relationship to R) of each material. As shown in Table 2, VIP has the
wall itself. However, these factors are still insufficient to identify the lowest k and the highest R the same R/k inverse relationship also
overall thermal property. This heat transfer can be calculated further applies in PE-Nylon and PS cases.
using Fourier’s law as in Equation (2). Then, the thermal conductivity
(k) can be derived from Equation (3). Next, the thermal resistance (R) Conclusion Based on the R and k concept, three boxes of
can be derived by Equation (4) . These thermal properties can be used 4VIP, PE Nylon, and PS materials should perform heat insulation
[8]
to compare box performance. The thermal conductivity implies how differently. The temperature increment of chilled water should be
much heat can be absorbed, hence in this case, lower absorption is significantly different among three boxes with the lowest temperature
better. Finally, the thermal resistance identifies how much the heat with the high R. However, the results show that the temperature chilled
will be resisted (or insulated) in the box; hence, higher resistance is water in three boxes is not significantly different at the 95% confidence
better. interval, among three boxes, based upon the physical simulation
Where Q = The heat transfer (W), k = Thermal conductivity (W/m-k), approach. While the R and k thermal properties concept is used to
R = thermal resistance, A = Surface of box (m ), x = Box thickness (m), differentiate materials scientifically, the usage condition also plays
2
dT/dx = Temperature gradient (K/m), m = Mass of water (kg), Cp = very important role in helping define which materials are the best
Specific heat of water (kJ/kg-K), dT/dt = The change in temperature (°C) performer. Practically, the high R material also comes with a higher
during a time interval (dt) or 5 min in our study. Then, the time-temperature price; therefore, the premium price of a VIP box might yield similar
profiles of each box are analyzed and calculated for the values of k, R results to less expensive boxes such as NE-Nylon or PS. The finding
and temperature increment. Finally, the statistical analysis is performed recommends the effective selection of a delivery box should involve
on all three boxes using a one-way analysis of variance (ANOVA) a holistic approach by using R and k along with a physical delivery
followed by a Tukey’s test at a 95% confidence level. simulation since the R and k concept alone might be misleading and
prompt the selection of a non-economically viable option.
Results and Discussion
33.1 Time-temperature profile of three materials During the first
20 minutes, thermal equilibrium occurred since the inside box
temperature was slightly decreased as shown in Figure 2(a) and 2(b).
The heat transfer to the chilled water results in temperature increasing เอกสารอ้างอิง/References
as shown in Figure 2(d). When the temperature at two sides of the boxes [1] Ndraha N, Sung W C and Hsiao H I 2019 J. Food Eng. 242 21.
is significantly different, then heat transfer occurs. In Figure 2(c), the [2] Chung K H, Park, M S, Kim H Y and Bahk G J 2019 Food Control. 98 187.
upper outer box temperature is average at 25 ± 1.5°C while the upper [3] Ndraha N, Hsiao H I, Vlajic J, Yang M F, and Lin H T 2018 Food Control.
inner average temperature of VIP, PE-Nylon, and PS are 20.07 ± 0.76°C, 89 12.
23.81 ± 0.24°C and 22.04 ± 0.37°C, respectively. For the side inner box, [4] Rattanawong, A and Ongkunaruk, P 2016. KnE Life Sciences 253.
the average temperatures are 19.08 ± 0.92°C, 22.87 ± 0.24°C and [5] Hsiao, H I and K L Huang. 2016. Food Control 64 181.
[6]
21.10 ± 0.37°C for VIP, PE-Nylon, and PS, respectively. The box with Dieckmann E, Nagy B, Yiakoumetti K, Sheldrick L, and Cheeseman C
the best performance is of VIP construction, which has the smallest 2019 Food Packag. Shelf Life. 21 100360.
Cengel Y A and Boles M A 2007 (Eds.) In Thermodynamics, McGraw-Hill,
[7]
incremental temperature in 3 hours for 7.53 ± 0.61°C. The next best 976 pages.
performance is PS at 8.41 ± 0.17°C and finally PE-Nylon at 8.91 ± 0.22°C [8] Holman J P 2002 (Eds.) In Heat Transfer, McGraw-Hill, 665 pages.
82 82 FOOD FOCUS THAILAND JUL 20
FOOD FOCUS THAILAND
JUL 202020
20/6/2563 BE 16:03
78-82_Storage Hand_Porntipa.indd 82 20/6/2563 BE 16:03
78-82_Storage Hand_Porntipa.indd 82