
Page 67 - FoodFocusThailand No.223 October 2024
P. 67
STRONG QC & QA
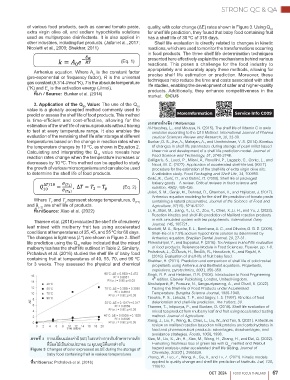
of various food products, such as canned tomato paste, quality, with color change (ΔE) rates shown in Figure 3. Using Q
10
extra virgin olive oil, and sodium hypochlorite solutions for shelf life prediction, they found that baby food containing fruit
used as multipurpose disinfectants. It is also applied in has a shelf life of 30 ºC of 318 days.
other industries, including fuel products. (Jafari et al., 2017; Shelf life evaluation is directly related to changes in kinetic
Nicoletti et al., 2009; Shekhar, 2011) reactions, which are used to monitor the transformations occurring
in food products. The three shelf life determination techniques
(Eq. 1) presented here effectively explain the mechanisms behind various
reactions. This poses a challenge for the food industry to
Arrhenius equation. Where A is the constant factor appropriately and accurately apply these methods, allowing for
0
(pre-exponential or frequency factor), R is the universal precise shelf life estimation or prediction. Moreover, these
gas constant (8.314 J/mol °K), T is the absolute temperature techniques help reduce the time and costs associated with shelf
(°K) and E is the activation energy (J/mol). life studies, enabling the development of safer and higher-quality
products. Additionally, they enhance competitiveness in the
a
ที่่�มา / Source: Bunkar et al. (2014) market.
3. Application of the Q Value: The use of the Q 10
10
value is a globally accepted method commonly used to
predict or assess the shelf life of food products. This method More Information Service Info C009
is time-efficient and cost-effective, allowing for the
estimation of the shelf life of various products without having เอกสารอ้างอิง / References
Al-Haushey, L., and Moussa, N. (2015). The shelf life of Vitamin C in aw/o
to test at every temperature range. It also enables the emulsion according to the Q10 Method. International Journal of Pharma
evaluation of the remaining shelf life after storage at different ceutical Sciences Review and Research, 30, 33-39.
temperatures based on the change in reaction rates when Bunkar, D. S., Jha, A., Mahajan, A., and Unnikrishnan, V. S. (2014). Kinetics
the temperature changes by 10 ºC, as shown in Equation 2. of changes in shelf life parameters during storage of pearl millet based
Calculating and interpreting the Q value reveals how kheer mix and development of a shelf life prediction model. Journal of
10
reaction rates change when the temperature increases or Food Science and Technology, 51, 3740-3748.
Calligaris, S., Lucci, P., Milani, A., Rovellini, P., Lagazio, C., Conte, L., and
decreases by 10 ºC. This method can be applied to study Nicoli, M. C. (2022). Application of accelerated shelf-life test (ASLT)
the growth of various microorganisms and can also be used procedure for the estimation of the shelf-life of extra virgin olive oils:
to determine the shelf life of food products. A validation study. Food Packaging and Shelf Life, 34, 100990.
`
Galic, K., Curic, D., and Gabric, D. (2009). Shelf life of packaged
`
`
`
bakery goods—A review. Critical reviews in food science and
(Eq. 2) nutrition, 49(5), 405-426.
Jafari, S. M., Ganje, M., Dehnad, D., Ghanbari, V., and Hajitabar, J. (2017).
Arrhenius equation modeling for the shelf life prediction of tomato paste
Where T and T represent storage temperatures, θ (T1) containing a natural preservative. Journal of the Science of Food and
2
1
and θ (T2) are shelf life of products. Agriculture, 97(15), 5216-5222.
ที่่�มา/Source: Xiao et al. (2022) Li, H., Bian, M., Jiang, Y., Li, C., Zou, Y., Chen, X.,Li. H., and Yu, J. (2023).
Reaction kinetics and shelf-life prediction of Maillard reaction products
Thamee et al. (2018) evaluated the shelf life of mulberry in milk simulated system with tea polyphenols. International Dairy
Journal, 145, 105721.
leaf mixed with mulberry fruit tea using accelerated Nicoletti, M. A., Siqueira, E. L., Bombana, A. C., and Oliveira, G. G. D. (2009).
conditions at temperatures of 35, 45, and 55 ºC for 60 days. Shelf-life of a 2.5% sodium hypochlorite solution as determined by
The changes in lightness (L*) are shown in Figure 2. Shelf Arrhenius equation. Brazilian Dental Journal, 20, 27-31.
life prediction using the Q value indicated that the mixed Phimolsiripol, Y., and Suppakul, P. (2016). Techniques in shelf life evaluation
10
mulberry tea has the shelf life outlined in Table 2. Similarly, of food products. Reference Module in Food Sciences. Elsevier. pp. 1-8.
<
<
<
Prchalová et al. (2016) studied the shelf life of baby food Prchalová, J., CíZková, H., Ševcík, R., Hanušová, K., and Rajchl, A.
(2016). Evaluation of shelf-life of fruit baby food.
containing fruit at temperatures of 40, 55, 70, and 90 ºC Shekhar, H. (2011). Prediction and comparison of shelf life of solid rocket
for 3 weeks. They assessed the physical and chemical propellants using Arrhenius and Berthelot equations. Propellants,
explosives, pyrotechnics, 36(4), 356-359.
Singh, R. P. and Heldman, D.R. (2008). Introduction to Food Engineering.
4 edition. Elsevier Publishing, London, United Kingdom.
th
Sinchaipanit, P., Peasura, N., Sangsuriyawong, A., and Disnil, S. (2022).
Testing the Shelf-life of Food Products under Accelerated
Temperature. Burapha Science Journal, 1930-1949.
Taoukis, P. S., Labuza, T. P., and Saguy, I. S. (1997). Kinetics of food
deterioration and shelf-life prediction. The Editors, 30.
Thamee, T., Intipunya, P., and Buntam, D. (2018). Shelf life evaluation of
mixed tea product from mulberry leaf and fruit using accelerated testing
method. Journal of Agriculture.
Xiang, J., Liu, F., Wang, B., Chen, L., Liu, W., and Tan, S. (2021). A literature
review on maillard reaction based on milk proteins and carbohydrates in
food and pharmaceutical products: advantages, disadvantages, and
avoidance strategies. Foods, 10(9), 1998.
ภาพที่่� 3 การเปลี่่�ยนแปลี่งค่่าสี่ (ΔE) ในระหว่่างการเก็บรักษาอาหารเด็็ก Xiao, M., Liu, S., Jin, H., Xiao, M., Wang, H., Zhang, H., and Dai, Q. (2022).
ที่่�มี่ผลี่ไมี้เป็นสี่ว่นประกอบ ณ อุณหภููมีิที่่�แตกต่างกัน Evaluating freshness loss of green tea with Q method and Weibull
10
Figure 3 Changes of color expressed as ΔE during the storage of hazard analysis under accelerated shelf life testing. Journal of
baby food containing fruit in various temperatures Chemistry, 2022(1), 2955839.
Zhang, W., Luo, Z., Wang, A., Gu, X., and Lv, Z. (2021). Kinetic models
ที่่�มา/Source: Prchalová et al. (2016) applied to quality change and shelf life prediction of kiwifruits. Lwt, 138,
110610.
OCT 2024 FOOD FOCUS THAILAND 67
63-67_Strong QC&QA_FIN.indd 67 24/9/2567 BE 09:11
24/9/2567 BE 09:11
63-67_Strong QC&QA_FIN.indd 67