Food FocusThailand
OCTOBER 2015
20
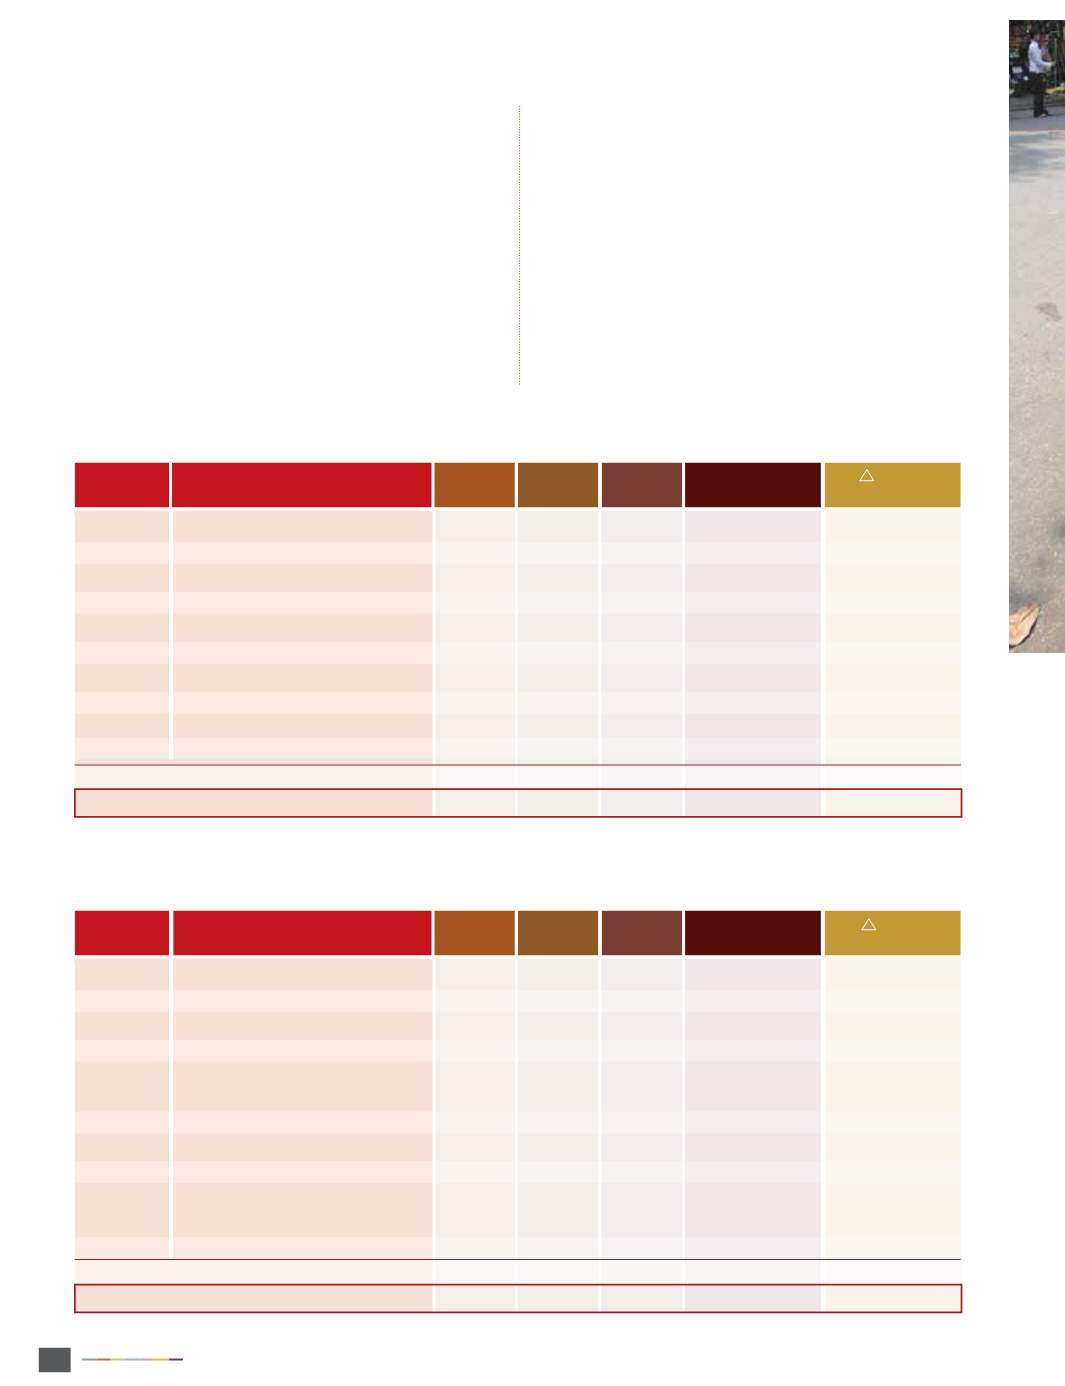
ตารางที่
1
สิ
นค้
าส่
งออกหลั
กของไทยไปตลาดเวี
ยดนามปี
2555-2558 (มู
ลค่
า: ล้
านเหรี
ยญสหรั
ฐ)
Table 1
Major Exports fromThailand toVietnam from2012 to2015 (Value: USDmillion)
Ranking
Product
2012
2013
2014
2015
(January – June)
% 2015
(January–June)
โดยการเพิ่
มประสิ
ทธิ
ภาพและเพิ่
มเสถี
ยรภาพทางเศรษฐกิ
จ รวมถึ
ง
การเพิ่
มการลงทุ
นโดยตรงจากต่
างประเทศ (FDI) ซึ่
งส่
งผลดี
ต่
อการอั
ตราการ
ขยายตั
วทางเศรษฐกิ
จการส่
งออกของเวี
ยดนามปี
2557ขยายตั
วร้
อยละ 11
การค้
าระหว่
างประเทศของเวี
ยดนาม
การค้
าเวี
ยดนามในช่
วง4 เดื
อนแรก (ม.ค.-เม.ย. 2558)มี
มู
ลค่
า103,208
ล้
านเหรี
ยญสหรั
ฐ เพิ่
มขึ้
นร้
อยละ13.9 เป็
นการส่
งออก50,104ล้
านเหรี
ยญ-
สหรั
ฐ เพิ่
มขึ้
น ร้
อยละ 8.2 และน�
ำเข้
า 53,103 ล้
านเหรี
ยญสหรั
ฐ เพิ่
มขึ้
น
ร้
อยละ19.9 ส�
ำนั
กงานสถิ
ติ
แห่
งชาติ
เวี
ยดนามรายงานว่
าสถิ
ติ
การขาดดุ
ล
การค้
าสู
งขึ้
นส่
วนหนึ่
งเป็
นผลจากการก่
อสร้
างและการลงทุ
นในโครงสร้
าง
พื้
นฐาน ซึ่
งจ�
ำเป็
นต้
องน�
ำเข้
าวั
สดุ
อุ
ปกรณ์
ส�
ำหรั
บการลงทุ
น ซึ่
งเวี
ยดนาม
Vietnam’s International Trade
Trade forVietnamduring thefirst fourmonths (January–April2015)
wasworthUSD103.2billion, an increaseof 13.9percent. Exports
accounted for USD50.1 billion of this trade, up 8.2 percent; and
importswereworthUSD53.1billion,up19.9percent. TheNational
Statistics Office of Vietnam reported that the total trade deficit
increased, partly as a result of the construction and investment in
infrastructure. Itwasnecessary to importmaterialsandequipment
forvarious infrastructureprojectsbecausedomesticmaterialshave
not developed as expected.
Thai –VietnameseTrade
For total trade in2014, VietnamwasThailand’s11
th
largest trading
partner in the world and its 4
th
largest in ASEAN after Malaysia,
Singapore, and Indonesia. In the five years from 2010 to 2014,
Ranking
Product
ตารางที่
2
สิ
นค้
าน�
ำเข้
าส�
ำคั
ญจากเวี
ยดนามปี
2555-2558 (มู
ลค่
า: ล้
านเหรี
ยญสหรั
ฐ)
Table 2
Major Imports fromVietnam from2012 to2015 (Value: USDmillion)
PetroleumProducts
Automobiles, parts, and accessories
Plastic pellets
Chemicals
Air conditioners and components
Beverages
Iron, steel, and products
Electrical appliances and components
Paper and paper products
Machinery andmachine components
832.9
248.4
490.8
436.6
154.9
137.9
261.1
145.4
180.3
212.3
3,382.6
6,483.3
603.7
378.8
535.6
478.5
237.8
239.6
255.7
177.8
225.0
309.1
3,740.6
7,182.2
829.2
522.3
600.3
506.0
295.9
304.7
328.9
168.2
253.0
233.8
3,840.0
7,882.4
482.3
317.1
272.5
248.4
235.0
196.9
148.6
122.1
120.8
115.1
1,884.1
4,142.9
98.35
55.38
-7.71
5.36
32.37
31.75
-8.29
26.46
1.51
8.81
8.18
17.35
1
2
3
4
5
6
7
8
9
10
Other products
Total
Other products
Total
Electrical appliance
Crude oil
Electrical machinery and components
Iron, steel and products
Fresh, chilled, frozen, processed
and semi-processed aquatic animals
Machinery and components
Autoparts and accessories
Wire and cable
Computers, equipment, and
components
Coffee, tea, spices
685.7
206.2
233.2
186.5
100.0
90.3
78.2
46.5
93.3
79.7
1,186.6
2,986.3
1,005.7
67.5
229.3
236.4
107.8
100.0
84.1
44.0
111.4
42.4
1,240.3
3,269.0
1,211.6
237.8
259.2
259.4
141.5
109.4
109.2
64.1
120.3
106.9
1,318.1
3,937.6
595.4
182.9
124.5
123.6
84.3
61.8
61.1
58.8
50.5
48.1
728.7
2,119.7
-8.84
68.33
-0.21
11.34
18.62
13.77
20.44
125.98
-14.74
43.92
16.37
10.48
1
2
3
4
5
6
7
8
9
10
2012
2013
2014
2015
(January – June)
% 2015
(January–June)


