74
Chilled& FrozenProducts
SUPPLEMENT EDITION
การส่
งออกไก่
สดแช่
เย็
น แช่
แข็
ง และแปรรู
ป
Exports of Chilled, Frozen, and Processed Chicken
Export Target for 2015
Expected togrowby5percent,andbeworthapproximatelyUS$2.42
billion.
Exports in 2015
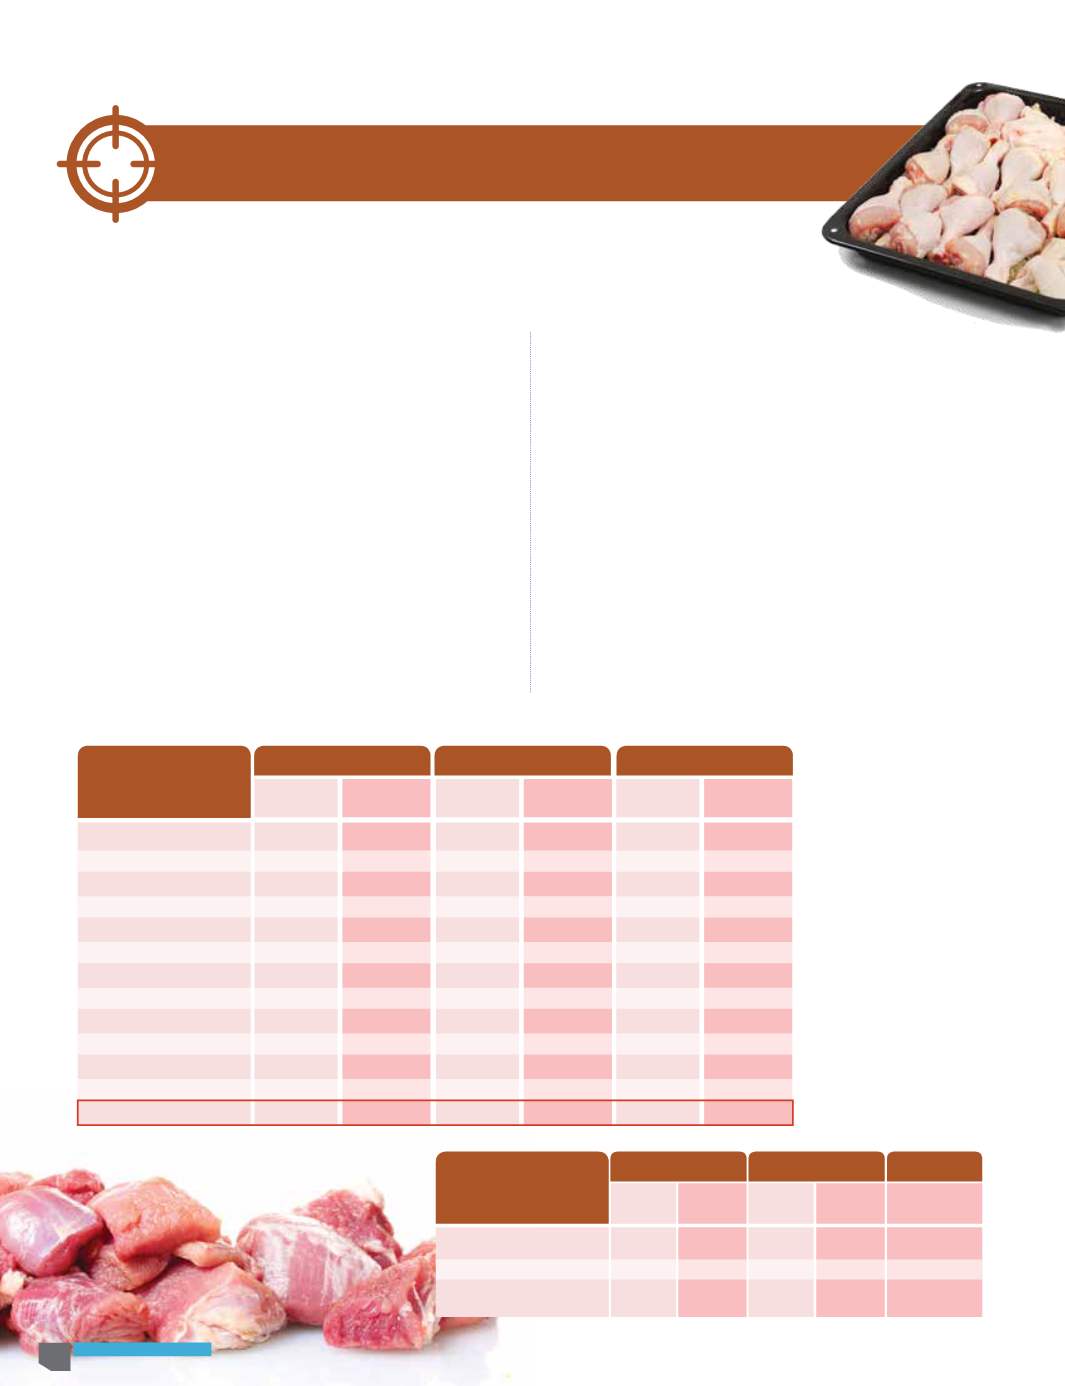
Exports of chilled, frozen, and processed chicken from January
throughMarch2015were144,758 tons,up21.09percent,andvalued
at US$575.29million, up 10%.
Broken down, exports included:
•Raw chicken - 42,517 tons (106.92%)
•Processed chicken - 102,240 tons (0.66%)
Chickenexports to theEU,which is theprimarymarket, declined
for both rawandprocessedchickensince theEuropeaneconomy is
still recovering.TheweakenedEuroalsocauseda reduction in trade,
and imports of poultry fell.
•Primarymarkets:
Japan, theUK, theNetherland, Laos,
andSingapore together accounted for 86.31 percent of
chicken exports.
•Marketswithhighgrowth rates:
SouthAfrica (+180%),
Malaysia (+169.95%), andCambodia(+100%)
เป้
าหมายการส่
งออกปี
2558
คาดว่
าจะขยายตั
วร้
อยละ5คิ
ดเป็
นมู
ลค่
าประมาณ2,417ล้
านเหรี
ยญสหรั
ฐ
การส่
งออกในปี
2558
การส่
งออกไก่
สดแช่
เย็
น แช่
แข็
ง และแปรรู
ป เดื
อนมกราคม-มี
นาคม 2558
มี
ปริ
มาณ 144,758 ตั
น เพิ่
มขึ้
นร้
อยละ 21.09 คิ
ดเป็
นมู
ลค่
า 575.29 ล้
าน
เหรี
ยญสหรั
ฐ เพิ่
มขึ้
นร้
อยละ 10แบ่
งเป็
น
• ไก่
สด42,517ตั
น (ร้
อยละ 106.92)
• ไก่
แปรรู
ป102,240ตั
น (ร้
อยละ 0.66)
การส่
งออกไก่
ไปสหภาพยุ
โรปซึ
่
งเป็
นตลาดหลั
กลดลง ทั้
งไก่
สดและ
แปรรู
ป เนื่
องจากเศรษฐกิ
จยุ
โรปยั
งไม่
ฟื
้
นตั
ว ค่
าเงิ
นยู
โรอ่
อนตั
ว ท�
ำให้
การซื้
อขายลดลงและน�
ำเข้
าเนื้
อไก่
ลดลง
• ตลาดหลั
ก:
ญี่
ปุ่
นสหราชอาณาจั
กร เนเธอร์
แลนด์
ลาวและ
สิ
งคโปร์
คิ
ดเป็
นสั
ดส่
วนรวมร้
อยละ 86.31
• ตลาดที่
มี
อั
ตราการขยายตั
วสู
ง:
แอฟริ
กาใต้
(เพิ่
มขึ้
นร้
อยละ 180)
มาเลเซี
ย (เพิ่
มขึ้
นร้
อยละ 169.95) และกั
มพู
ชา
(เพิ่
มขึ้
นร้
อยละ 100)
Country
Value : Million USD
Growth Rate (%)
Share (%)
2014
2014
2014
2015
(Jan-Mar)
2015
(Jan-Mar)
2015
(Jan-Mar)
Majot ExportingMarkets
1. Japan
2. Great Britain
3. Netherland
4. LaoPDR
5. Singapore
6. SouthKorea
7. Germany
8. HongKong
9. Canada
10. UAE
Total for 10Countries
ETC.
Total
1,022.60
606.79
169.41
115.55
64.42
37.50
70.48
39.16
26.69
27.57
2,180.17
121.8
2,301.97
266.23
143.33
32.11
30.78
17.32
17.06
13.71
11.01
8.42
7.19
547.06
28.23
575.29
1.8
15.96
-0.63
19.19
-5.76
-32.2
4.9
22.84
15.54
-9.31
5.25
-9.68
4.34
35.22
-11.48
-23.64
37.78
7.24
38.14
-28.18
37.45
21.15
-7.58
9.11
-4.63
10.00
44.24
26.36
7.36
5.02
2.8
1.63
3.06
1.7
1.16
1.2
94.71
5.29
100
46.28
24.90
5.58
5.35
3.01
2.97
2.38
1.91
1.46
1.25
95.09
4.91
100
Product
Value : Million USD
2014
2,302.73
1,907.76
394.97
469.34
105.95
-4.47
87.06
-3.03
120.73
81.58
18.42
575.29
4.34
10.00
100
2014
2015
(Jan-Mar)
2015
(Jan-Mar)
2015
(Jan-Mar)
Growth Rate (%)
Share (%)
Chilled, frozen, and
processed chicken
1. Processedchicken
2. chilled, frozen
chicken
Chilled, Frozen, and Processed Chicken Situation


