60
AUG2016
FOOD FOCUSTHAILAND
SOURCE OF
ENGINEER
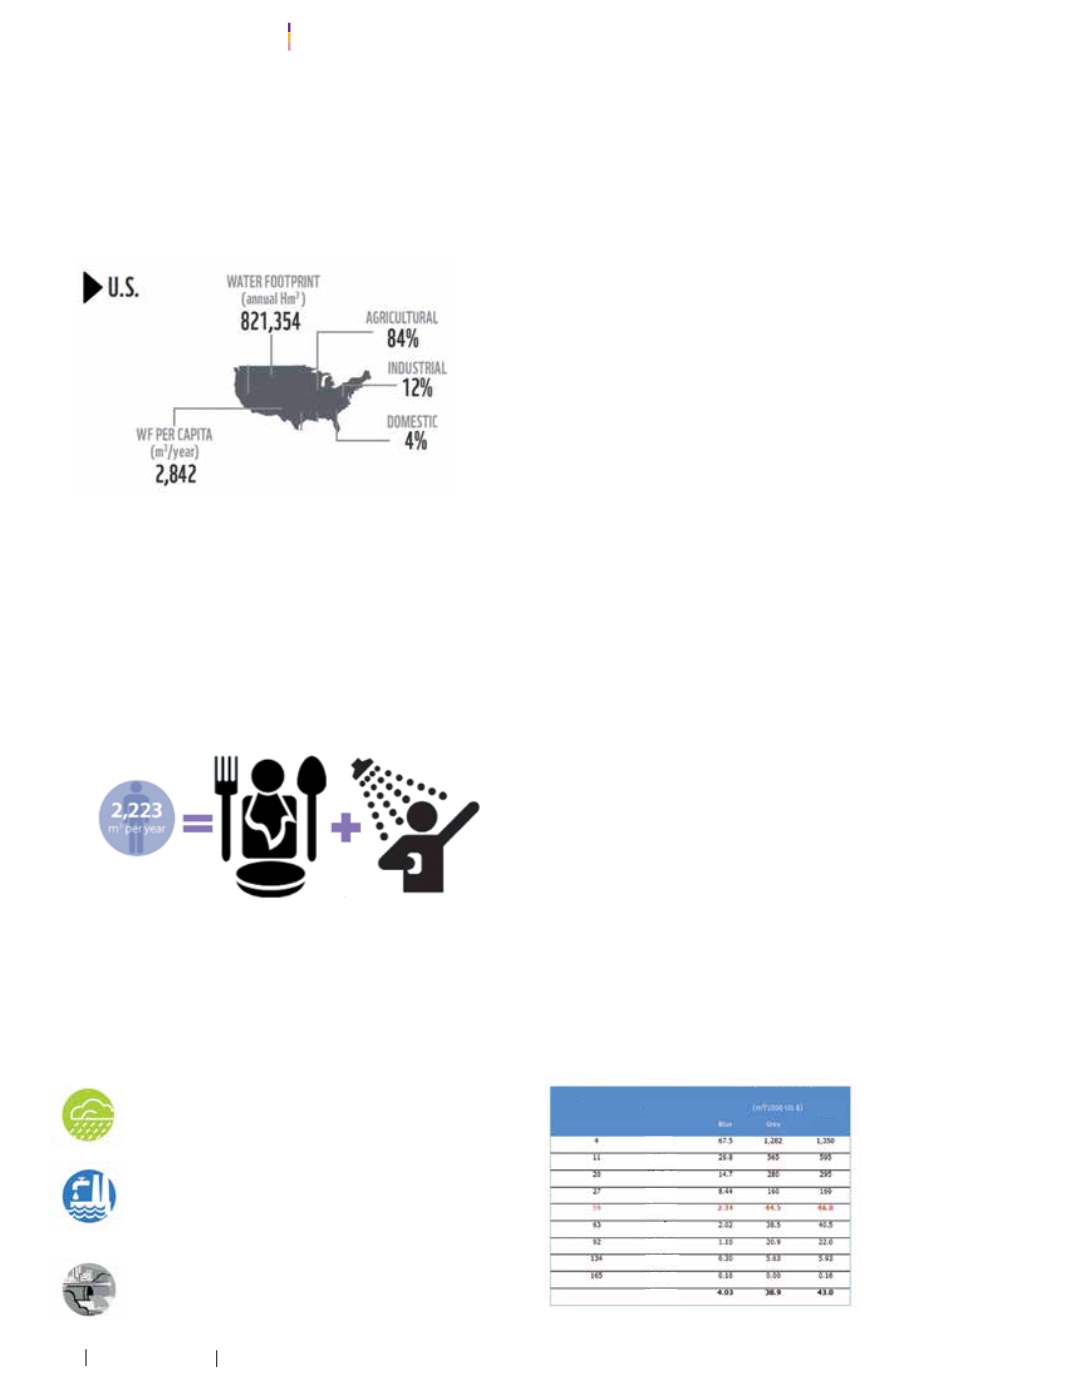
2.Water Footprint ของประเทศ (Water footprint of national consumption)
หมายถึ
ง ปริ
มาณน�้
ำที่
ใช้
ในการผลิ
ตสิ
นค้
าและบริ
การตามความต้
องการของ
ประชากรภายในประเทศ เช่
น ประเทศสหรั
ฐอเมริ
กามี
ค่
า Water footprint ของ
ประเทศเท่
ากั
บ 821,354 เฮกโตลู
กบาศก์
เมตรต่
อปี
หรื
อ 82 ล้
านลู
กบาศก์
เมตร
แบ่
งเป็
น Water footprint จากภาคเกษตรกรรม ภาคอุ
ตสาหกรรม และภาคครั
วเรื
อน
ร้
อยละ 84, 12และ 4ตามล�
ำดั
บ (ดั
งรู
ปที่
2)
shown in figure 2)
3.Water footprintofconsumer
means theamount ofwater the
consumers consumebothdirectly and indirectly. For example, as in
Thailand the amount of water footprint per capita equals to 2,223
cubicmeters per year (as shown in figure 3), that means all in one
year, there isonecitizenwhowants toconsumewater at anaverage
of 2,223 cubicmeters, or 6 cubicmeters per day.
Water footprint
comprisesof3partsofwater; theyareclassified
from thewater resourceswhicharegreenwater,bluewater,andgray
(Hoekstra et al, 2011). Details are as follows:
Greenwater footprint
means theamount of rainandwater in
the form of moist in the earthbeing used.
Blue water footprint
means the amount of water from the
natural sources likeearthsurfacewater, groundwater sourcessuch
as artisan wells, reservoirs, rivers and water adopted to use from
irrigation.
Greywater footprint
means theamount of vital inlandwaters,
dilutedwithcontaminationsandmerged intowatersources. Itdepends
on surroundingwater quality standards.
GlobalWater Footprint Circumstances
Resulted fromclimate turbulences,growth inglobal populations,and
changes inways of living, and increase demands, water resources,
whichplaysasignificant role inhumans’survival, isdecreasing.This
may lead tobrutal conflicts about water in the future. Consequently,
the concept of water footprint or trace of water has emerged. The
figures from theUnitedNationshaveconfirmed that theworldcontains
water up to three-fourths, but one-fifth of theworld populations are
shortage of clean water consumption. This has led to death tolls
caused by diseases from shortage of clean water consumption
annually at 27millionpeople, or one inevery 8 seconds. Thiswater
problem is themajor root of theworldcrisis.Not only that, thegrowth
ofhumanpopulationsandalso themigration from rural tourbanareas,
and the growing of industrial sectors which has changed humans’
consumptions.Todatebeefshavebeenconsumedmore thanedible
plants and fruit consumption. When it comes to producing beefs,
water isneededmore thananyotheredibleplants.Theproportionof
1 kilogramof beef needs theamount of water up to3,000 to15,000
liters, while riceproduction for 1unit only useswater at 1,000 liters.
Furthermore, toxins from water caused by poor management in
industries and agriculture have escalated vicious water crisis. The
conceptofwater footprintassists inconcretewatercalculation tosee
thewholephysical pictureofwatergloballyanddatagained from the
calculation can be used inmanaging water at optimal benefits and
highest efficiency.
The ratio of water footprint in Thailand reached the third in the
world. It is due to the lack of proficiency in tackling the use of water
in production. Water used per one product unit when comparing to
othercountries isextremelyhighespeciallywaterused inagriculture is
รู
ปที่
2
ตั
วอย่
างWater Footprint ของประเทศสหรั
ฐอเมริ
กา
Figure 2
Example ofWater Footprint of USA
ที่
มา/Source:
WorldWildlifeFund, 2012
3. Water Footprint ของผู้
บริ
โภค
(Water footprint of consumer)
หมายถึ
ง
ปริ
มาณน�้
ำที่
ผู
้
บริ
โภคบริ
โภคทั้
งทางตรงและทางอ้
อม เช่
น ประเทศไทยมี
ค่
า
Water footprint ต่
อหั
วประชากรเท่
ากั
บ 2,223 ลู
กบาศก์
เมตรต่
อปี
(ดั
งรู
ปที่
3)
นั่
นหมายถึ
งตลอดระยะเวลา 1 ปี
ประชาชน 1 คน จะมี
ความต้
องการน�้
ำเพื่
อใช้
ใน
การอุ
ปโภคและบริ
โภคเฉลี่
ย2,223ลู
กบาศก์
เมตรหรื
อ6ลู
กบาศก์
เมตรต่
อวั
น
รู
ปที่
3
ตั
วอย่
างWater Footprint ของผู้
บริ
โภค
Figure 3
Examples ofWater Footprint of Consumer
ที่
มา/Source:
US Infrastructure, 2014
Water Footprint
ประกอบด้
วยน�้
ำ 3ส่
วน ซึ่
งแบ่
งตามชนิ
ดของWater footprint
ตามแหล่
งที่
มา คื
อ น�้
ำสี
เขี
ยว น�้
ำสี
ฟ้
า และน�้
ำสี
เทา (Hoekstra และคณะ, 2011)
มี
รายละเอี
ยดดั
งนี้
Green Water Footprint
หมายถึ
ง ปริ
มาณน�้
ำฝน และน�้
ำที่
อยู
่
ในรู
ปของความชื้
นในดิ
นที่
ถู
กดึ
งไปใช้
Blue Water Footprint
หมายถึ
ง ปริ
มาณน�้
ำจากแหล่
งน�้
ำธรรมชาติ
รวมทั้
งแหล่
งน�้
ำผิ
วดิ
น และแหล่
งน�้
ำใต้
ดิ
น อั
นได้
แก่
น�้
ำบาดาล
น�้
ำจากอ่
างเก็
บน�้
ำแม่
น�้
ำน�้
ำจากชลประทานที่
ถู
กดึ
งไปใช้
Grey Water Footprint
หมายถึ
ง ปริ
มาณน�้
ำจื
ดที่
จ�
ำเป็
นต้
องใช้
ในการเจื
อจางสารมลพิ
ษที่
ปนเปื
้
อนลงสู
่
แหล่
งน�้
ำ ซึ่
งขึ้
นอยู
่
กั
บ
มาตรฐานคุ
ณภาพน�้
ำโดยรอบ
ตารางที่
1
การใช้
น�้
ำต่
อการผลิ
ตสิ
นค้
ามู
ลค่
าเพิ่
ม
ในภาคอุ
ตสากรรมจ�
ำแนกประเทศในอาเซี
ยน
Table1
Theamount of water is used toproduce
a value-addedproduct inASEAN
up to2,131cubic
meters/person/
y e a r . T h e
major cause
of high water
consumption in
Thailand stems
from production
f o r impo r t .
Besides, from
thedata retrieved
from the Water
FootprintNetwork
reveal ing the
assessment of
the amount of
water used in
producing value-
added products
ที่
มา/Source:
Water Footprint Network
Country
AverageWFof Value-addedProducts
Rankingof theWorld
MostWater Used
Market
Total
Vietnam
LaoPDR
Phillipines
Myanmar
Thailand
Malaysia
Cambodia
Indonesia
Singapore
World
Thailand


