37
AUG 2016 FOOD FOCUSTHAILAND
SURF THE
AEC
โดยเฉพาะถั่
วเหลื
อง ข้
าวบาร์
เลย์
ข้
าว น�้
ำตาลทราย
เนื้
อสั
ตว์
และผลิ
ตภั
ณฑ์
จ�
ำพวกแป้
ง การที่
จี
นเป็
นผู้
น�
ำเข้
า
สิ
นค้
าอาหารรายใหญ่
ท�
ำให้
จี
นมี
อิ
ทธิ
พลต่
อการเปลี
่
ยนแปลง
ของตลาดการค้
าสิ
นค้
าโภคภั
ณฑ์
จ�
ำพวกอาหารของโลก
เป็
นอย่
างมากโดยเฉพาะด้
านราคา
เศรษฐกิ
จจี
นชะลอตั
วส่
งผลท�
ำให้
ราคาสิ
นค้
าอาหาร
ตกต�่
ำ
ราคาสิ
นค้
าเกษตรและอาหารที่
เพิ่
มขึ้
นตลอดช่
วง
เกื
อบทศวรรษที่
ผ่
านมา ส่
วนหนึ่
งเป็
นผลมาจาก
ความต้
องการสิ
นค้
าเกษตรและอาหารของจี
นที่
เพิ่
มขึ้
น
ในขณะที่
อั
ตราการเพิ่
มขึ้
นของผลผลิ
ตสิ
นค้
าเกษตรทั่
วโลก
ไม่
ได้
ขยายตั
วมาก เนื่
องจากสภาพพื้
นที่
ที่
เหมาะสมในการ
เพาะปลู
กทั่
วโลกค่
อนข้
างมี
จ�
ำกั
ด ประกอบกั
บผลผลิ
ต
บางพื้
นที่
ได้
รั
บผลกระทบจากภาวะโลกร้
อน เป็
นปั
จจั
ย
ส�
ำคั
ญประการหนึ่
งที่
ส่
งผลท�
ำให้
ราคาสิ
นค้
าเกษตรอาหาร
ปรั
บตั
วสู
งขึ้
น
ในช่
วง2-3ปี
ที่
ผ่
านมาราคาสิ
นค้
าอาหารในตลาดโลก
ที่
ตกต�่
ำลงเป็
นผลสื
บเนื่
องมาจากภาวะซบเซาของเศรษฐกิ
จ
โลกที่
ได้
รั
บอิ
ทธิ
พลจากเศรษฐกิ
จจี
น ซึ่
งเป็
นประเทศ
importing products, it has a great impact on
changes inconsumer foodproductmarketson food
globally especially theprice.
Chinese Economy Slowdown Leads to
Decline inFoodPrice
The cause of escalating prices of agricultural
commodity and food products almost all decade
waspartlydue to thehigherdemandsofagricultural
commodity and food products, while the increase
rate of agricultural products worldwide did not
extendmuch.More important factorswhichcaused
agricultural commodityand foodproducts toadjust
into higher prices were that plots of land needed
for agriculture became limited and some crops in
certainareaswereaffectedby theglobalwarming
effects.
This past several years, the food products in
global market have decreased, and it has been
due to theworldeconomicdownturn influencedby
economic slump inChinawhich is themajor food
consumer of the world. During early 2016 the
overall world food prices have lowered to 26
percent from thehighest foodprices in2011.While
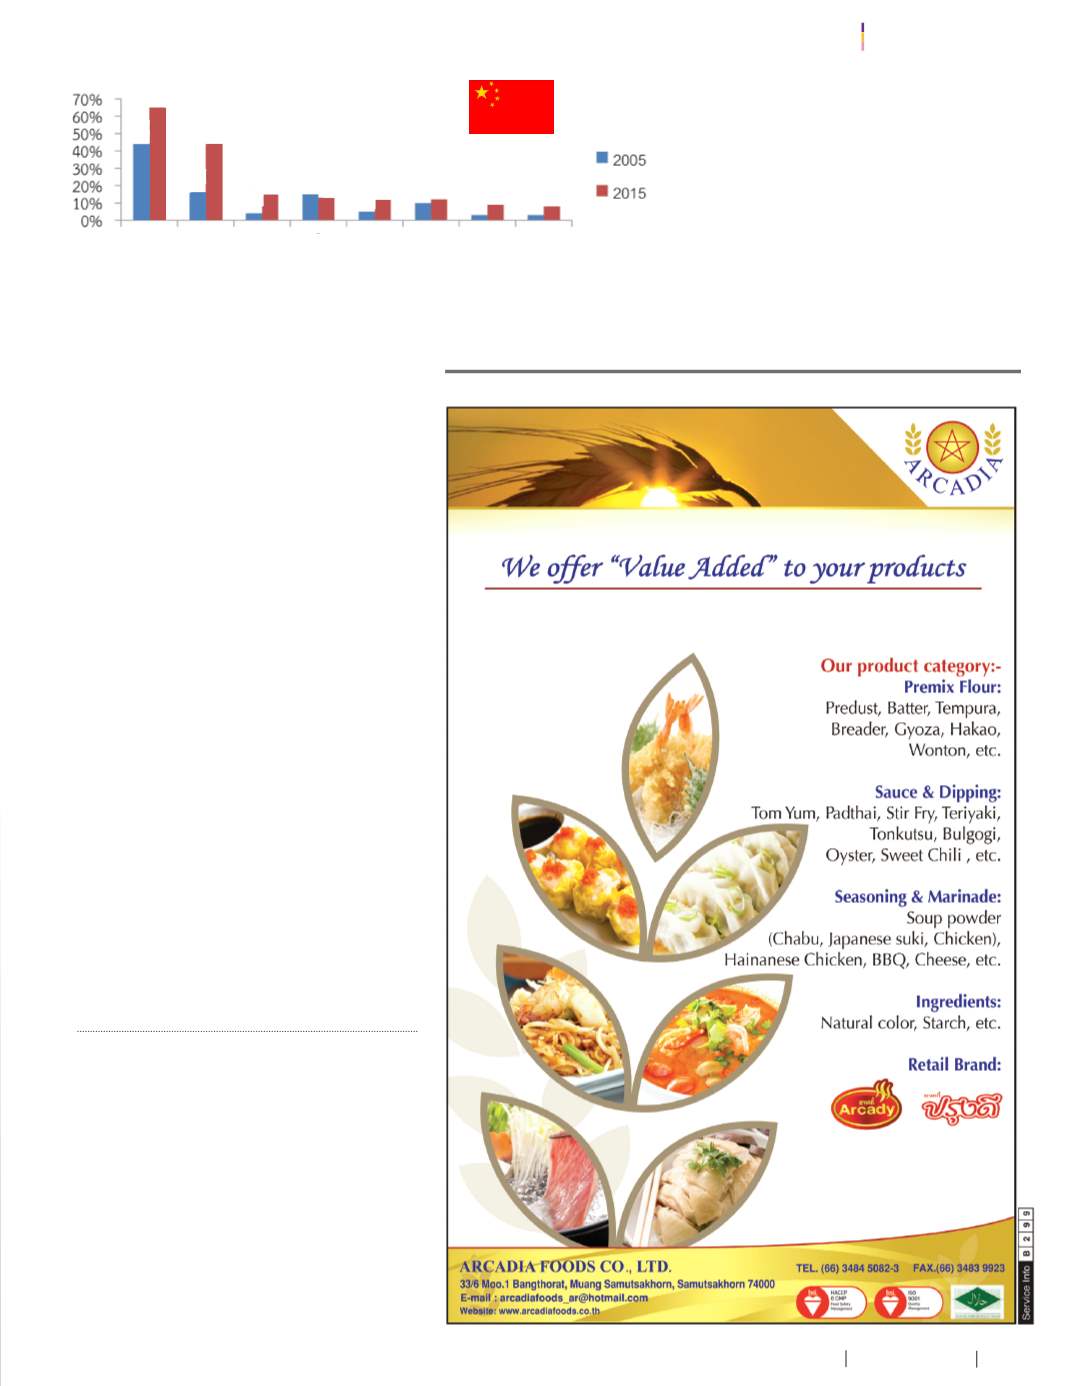
44%
16%
4%
5%
3% 3%
10%
15%
Soybean
Barley
Rice
VegOil (3)
Sugar
Seafood
Meat (2)
Flour
65%
44%
15% 13% 12%
9% 8%
12%
รู
ปที่
2
สั
ดส่
วนการน�
ำเข้
าสิ
นค้
าเกษตรอาหารของจี
นเที
ยบกั
บ
การค้
าสิ
นค้
านั้
นในตลาดโลก ในปี
2558 เที
ยบกั
บปี
2548 (สิ
นค้
า
ทั้
งหมดที่
แสดงคื
อสิ
นค้
าที่
จี
นเป็
นผู้
นาเข้
าอั
นดั
บที่
1 ของโลก ยกเว้
น
น้
ามั
นพื
ชและเนื้
อสั
ตว์
)
Figure 2
The proportion of China’s imports of agricultural
products compared to trade in the global market in 2015,
compared to the year 2005 (All shown is the products that
China is thenumberoneof theworld’s largest importerexcept
only edibleoil andmeat)
ที่
มา/Source:
Global TradeAtlas


